Objective
Our client is an American company that provides software development services to leading healthcare organizations.
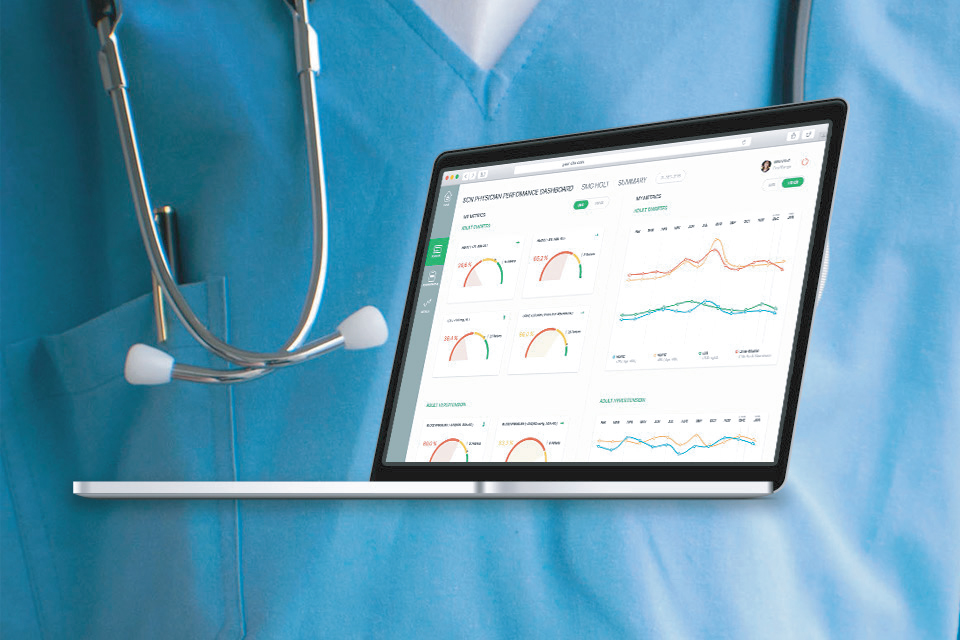
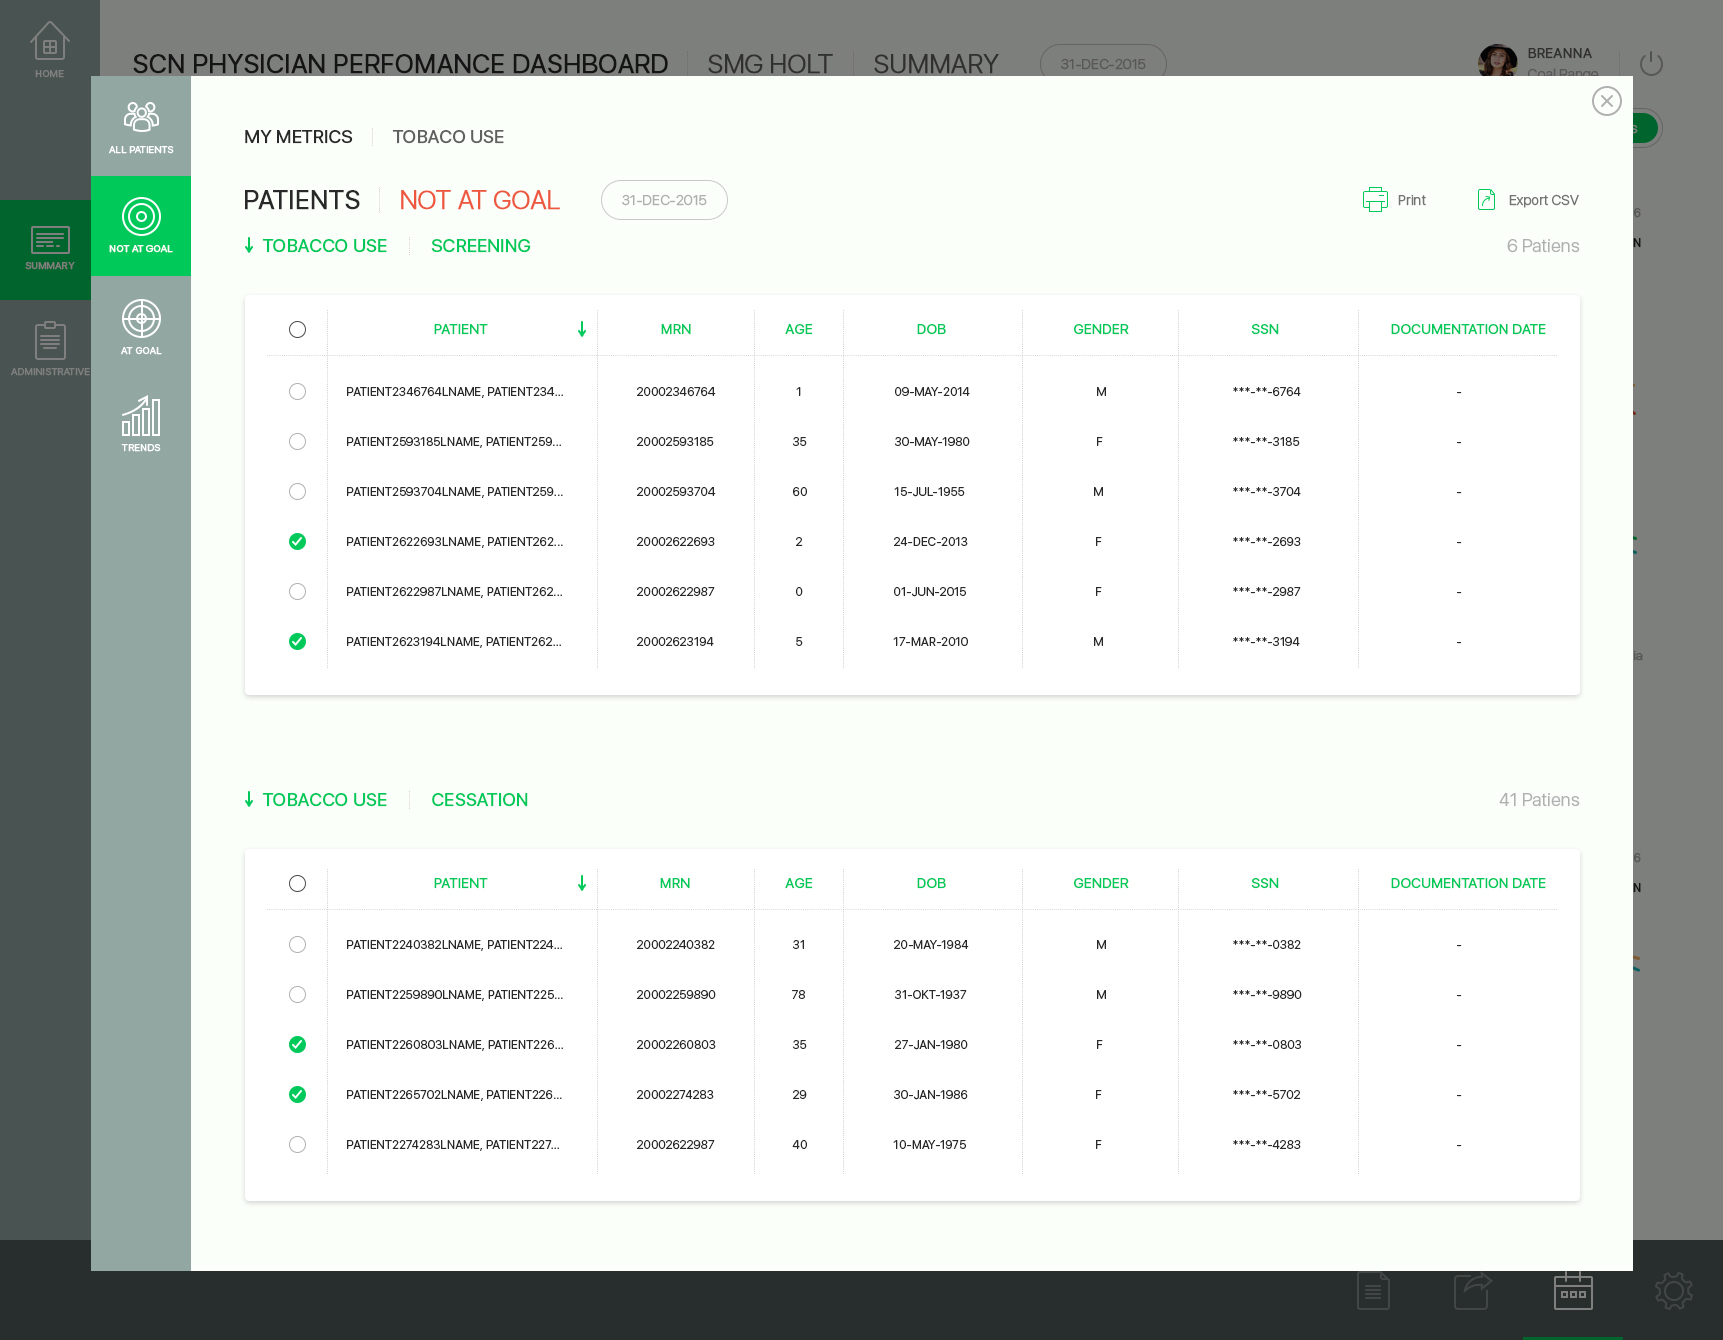
The client asked us to develop a web interface for an application that provides access to statistical information regarding the quality of a physician’s performance. The client required that the data be displayed in a user-friendly format, with the option for data to be exported for further analysis. The application was aimed at helping medical center staff to conduct prompt monitoring of their practitioner’s professional performance and regulatory compliance.
Solution
Axmor developed the web application in strict accordance with the client’s prototype. In order to precisely meet our client’s requirements, some of the visual data presentation elements were developed from scratch without the use of third-party components.
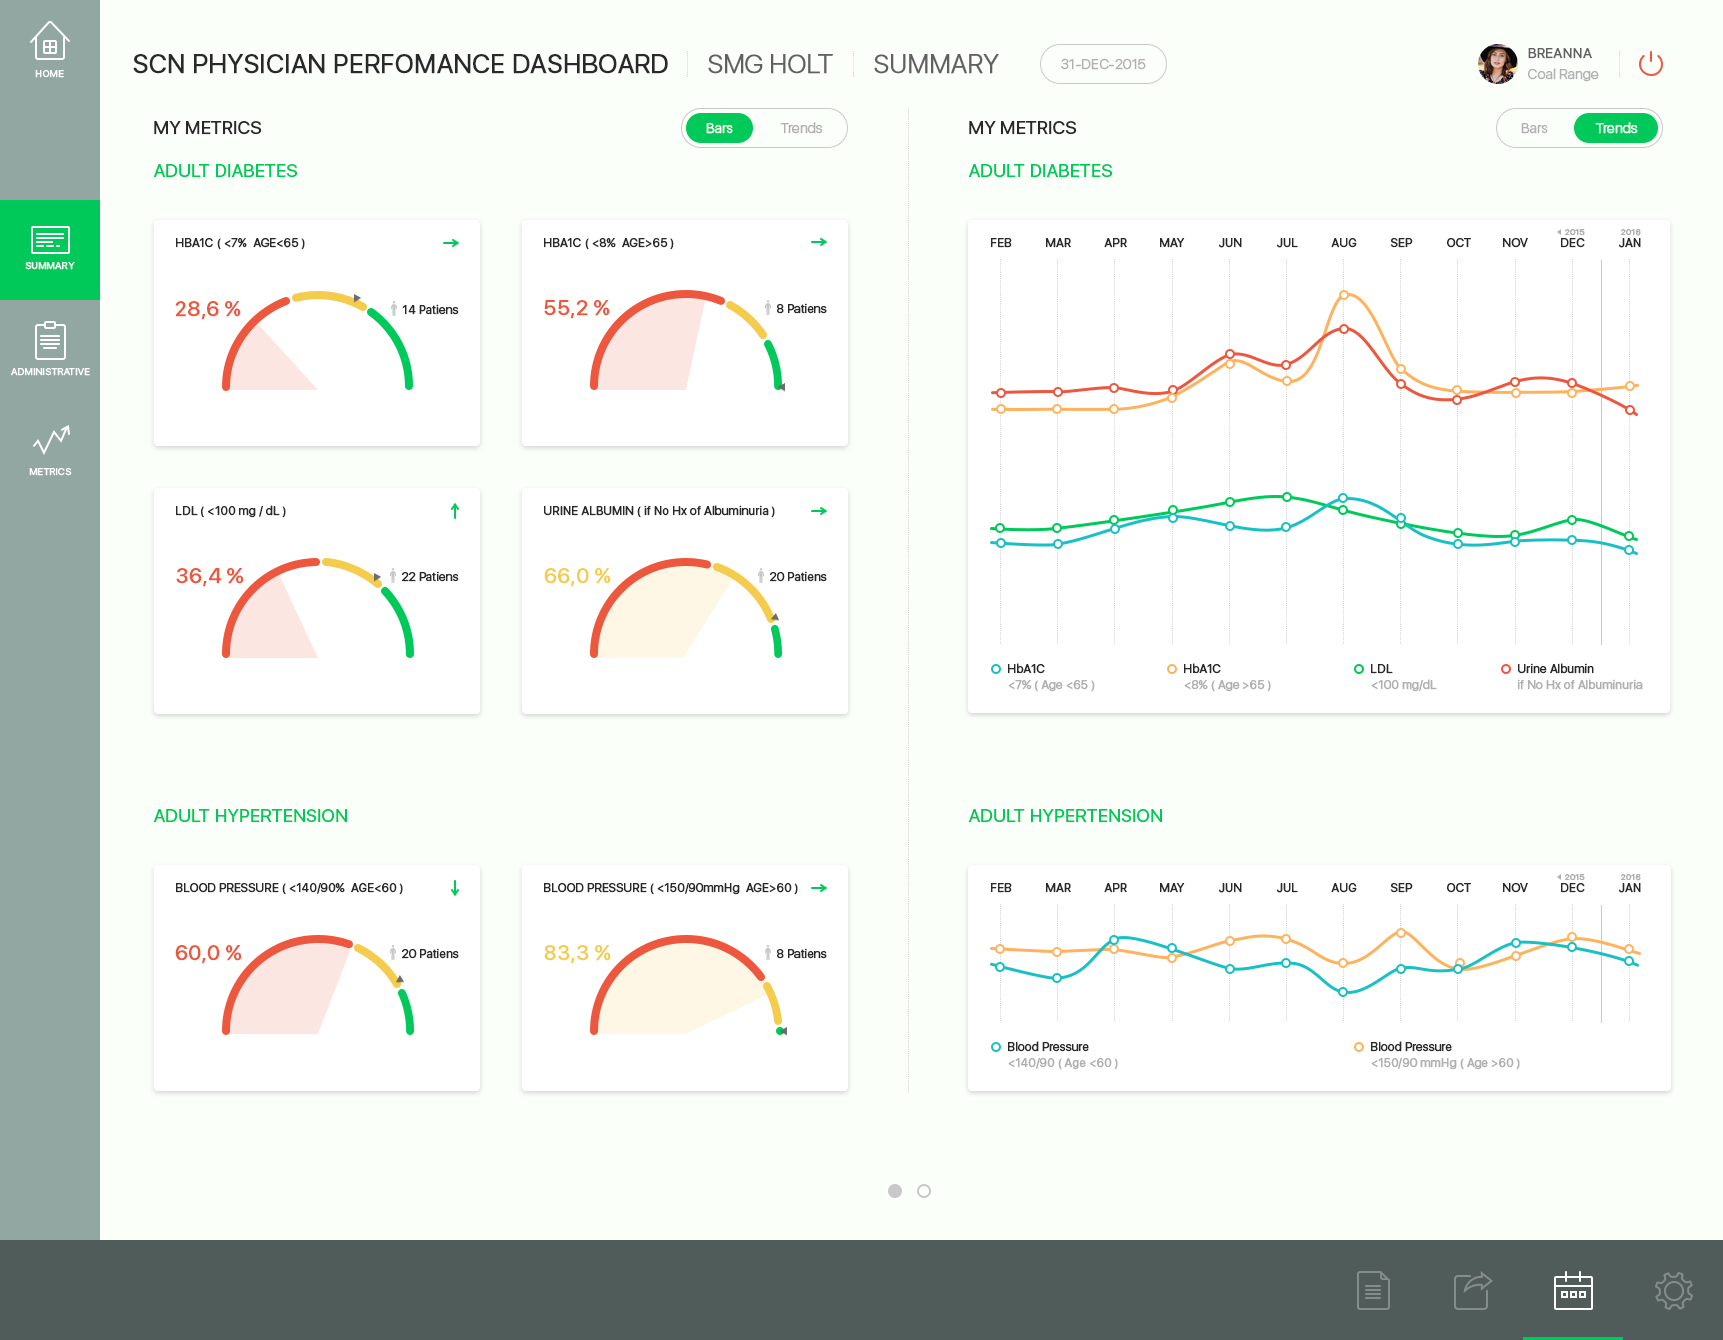
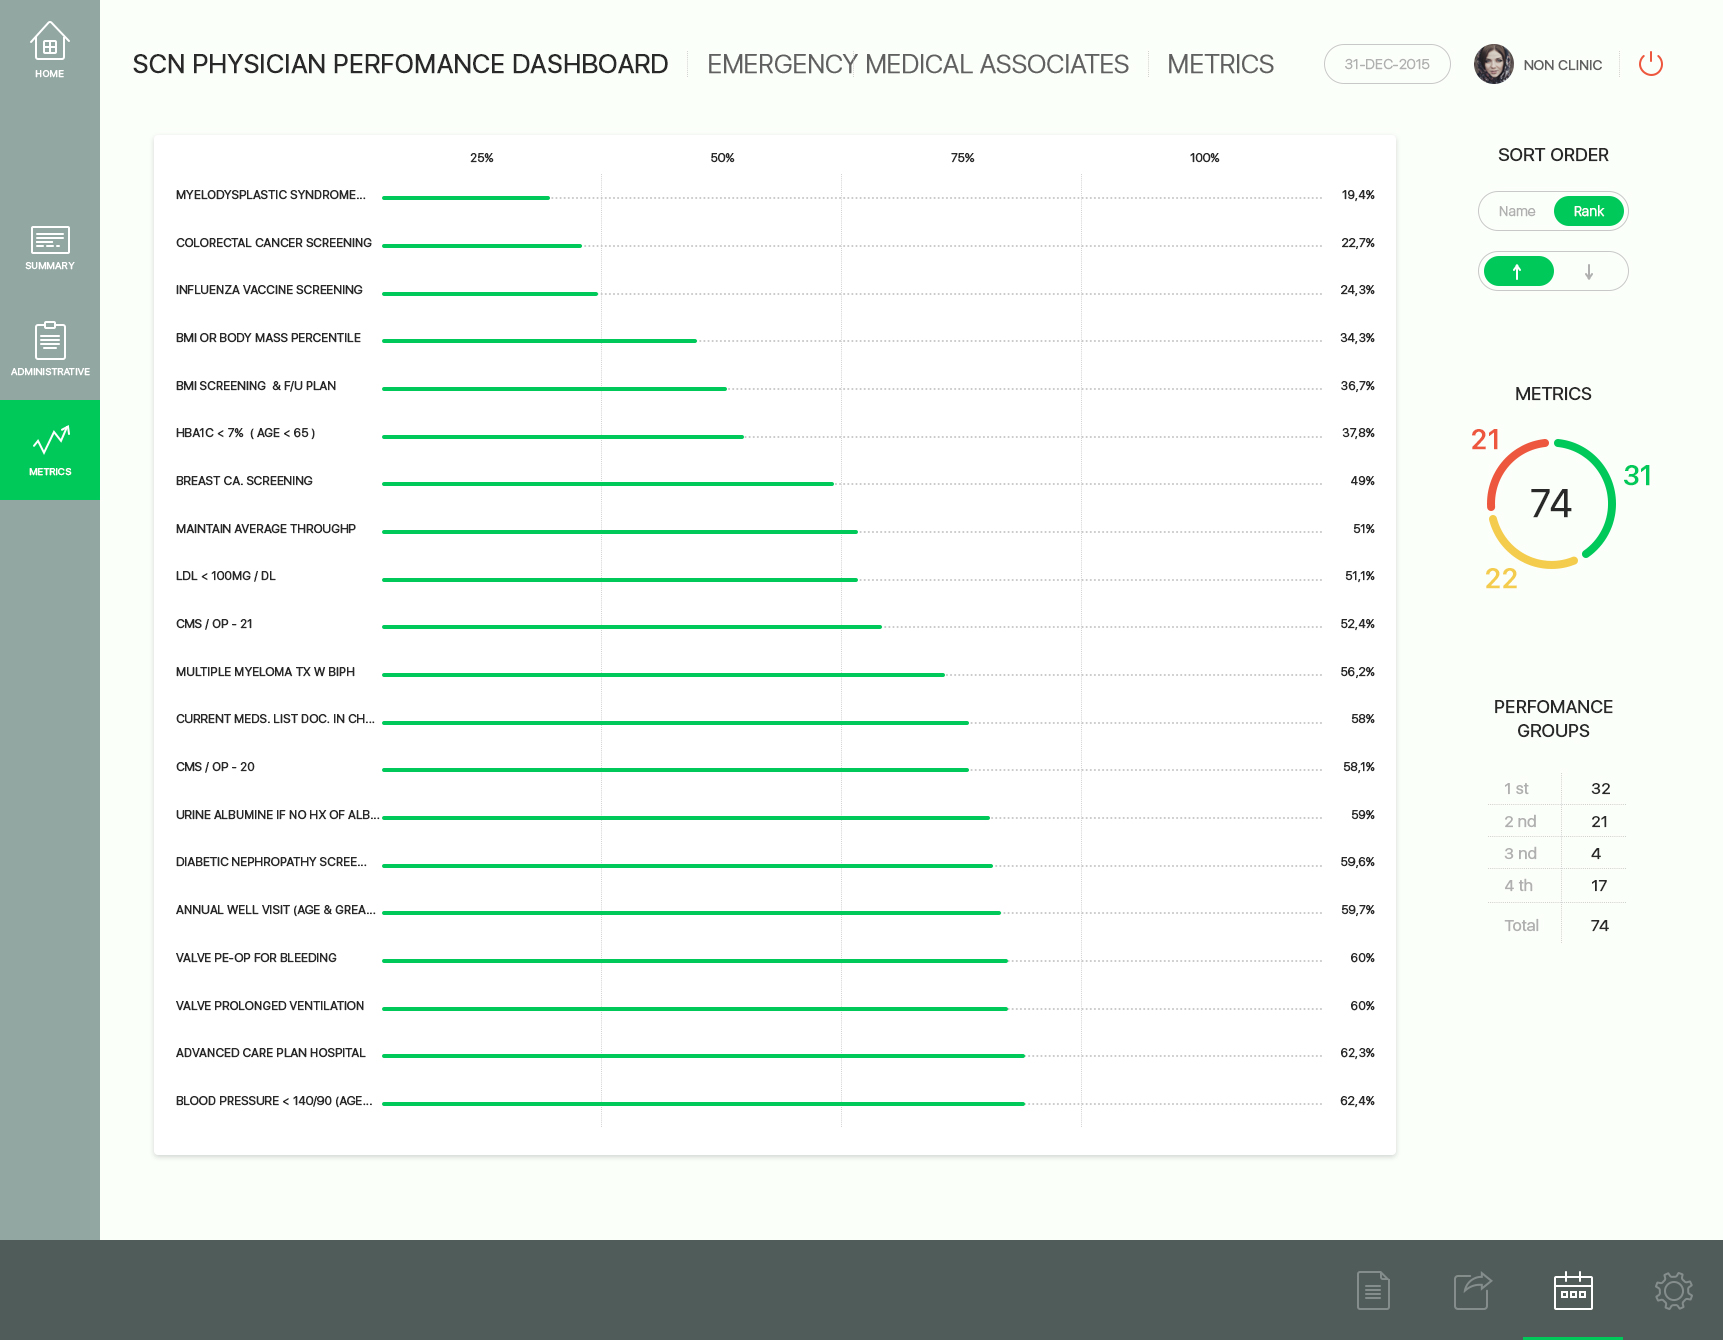
Data visualization communicates information through graphical means. A single diagram can display various types of metric data simultaneously: current value, set range, best and mean result. All statistical calculations are processed in the database in order to lighten the load on the client’s side of the application. This user-friendly format delivers up-to-date information on the quality performance of a physician, quickly and efficiently.
The system administrator can use recommended reports or customize their own in accordance with the specific requirements of a particular medical establishment or individual physician. The application has been designed in such a way that alterations can easily be made to annual reports in response to yearly changes in recommendations and requirements. In the future we plan to introduce a feature for the preparation of PQRS data files for submission.
The system enables different user roles to be set up for physicians, medical institution managers, and system administrators. Depending on their role, users can access various functionalities within the system, viewing the following: current metrics, patient data, physician and organization data, in addition to the ability to customize reports.
We developed the application in strict accordance with the client’s requirements, from the selection of appropriate technology, to the precise dimensions and animation of graphic elements.
We used generic data stored in an SQL database to avoid using real patient records during the development process.
Operating as a single cross-functional team with common goals and objectives we created an effective process of communication with the client. We used the AGILE development process to optimize interaction with the client’s team, including their involvement in daily project status discussions and the use of a common SCRUM board in MS TFS. Our team worked on developing the web interface, while the client’s team created the database and carried out testing.
Fortnightly sprints and daily on-line communication at the active development stage allowed us to respond swiftly to changes and establish effective interaction within the team to ensure the prompt resolution of complex technical challenges.
Our team became involved at the early stages of MVP development, when the experience of a highly skilled team can play a vitally important role. Involvement at this stage enabled us to develop and produce a new product with an optimal quality/price ratio.


