Data Analysis of Music Festival Tweets
Objective
IBM jStart (a concern of the IBM Software Solutions Group) contacted Axmor with the aim of gathering tweets related to music festivals, subsequently providing data analysis, identification of certain patterns and breakdowns of visual analytics.
The outcome — the BlueMix Insights service and IBM Watson analytical services capabilities demonstration.
Solution
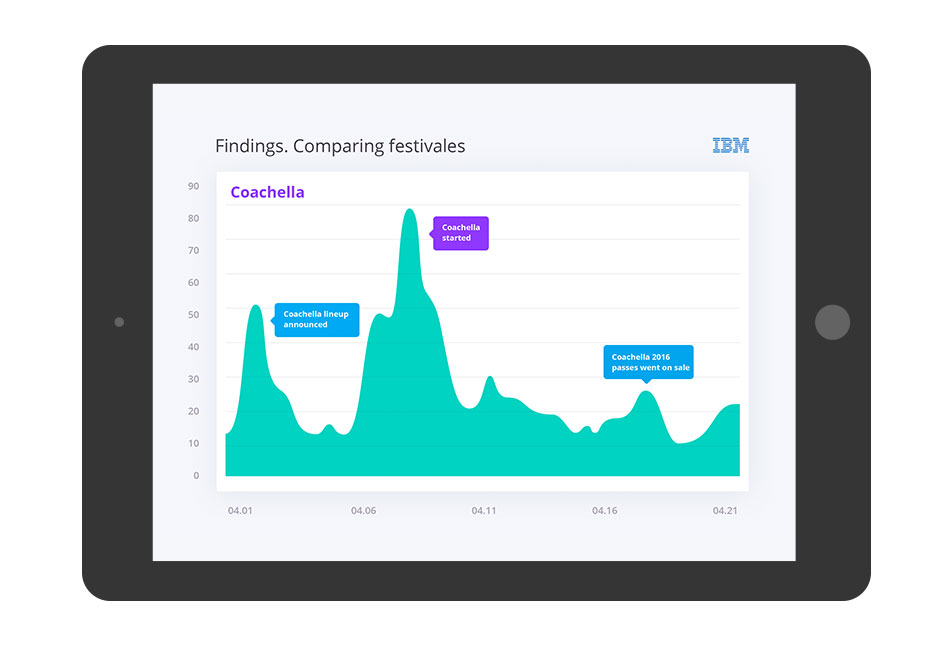
Over the course of three months, the Axmor team aggregated and analyzed over 2000 tweets focusing on the Coachella festival and similar music events, in addition to popular artists from our client's list. The data was collected using the BlueMix Insights service. The BlueMix Watson Tone Analyzer tool was implemented in order to analyze message tonality.
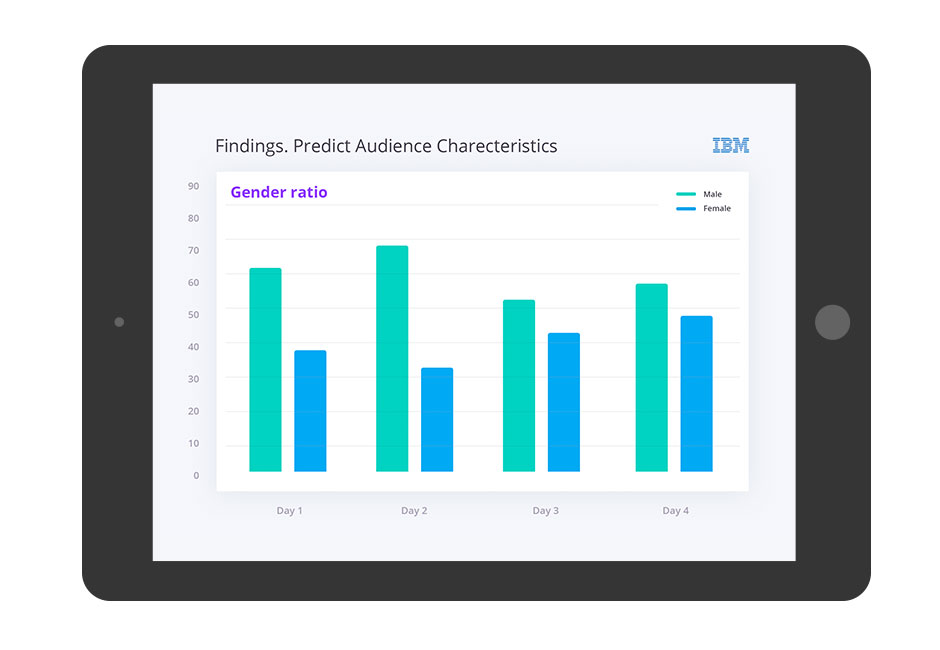
Utilizing machine learning technology, Axmor developed a trigger driven model which classifies determined tweets.
Utilizing the BlueMix Insights service, the Axmor team gathered all the tweets within a twelve month period, in which festivals or relevant artists were mentioned.
Spark Notebook and Jupyter Notebook in Python were used in the data mining process.
Incorporating machine learning technologies, Axmor developers designed a trigger driven data model for the classification of tweets.
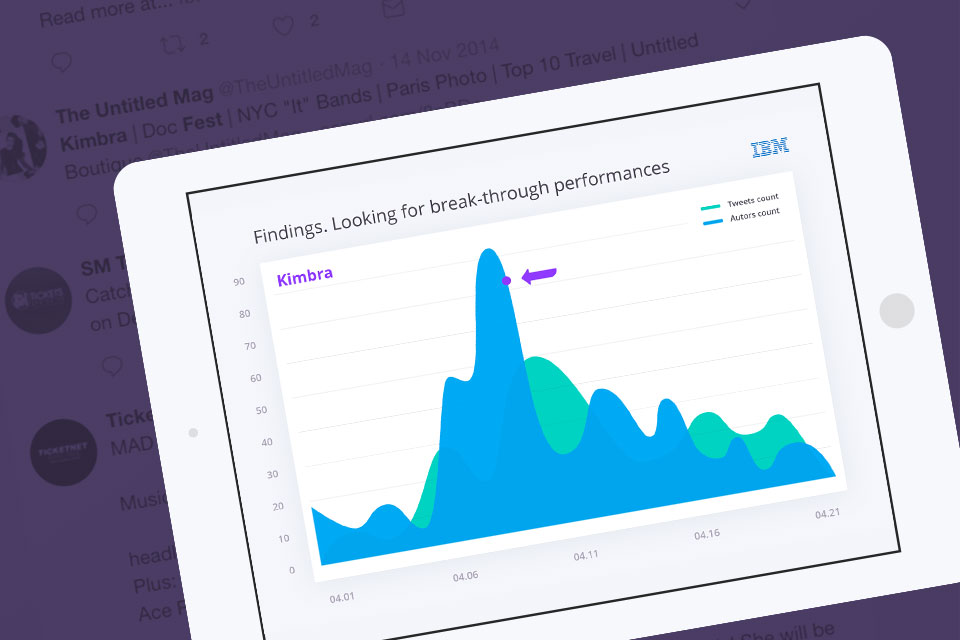
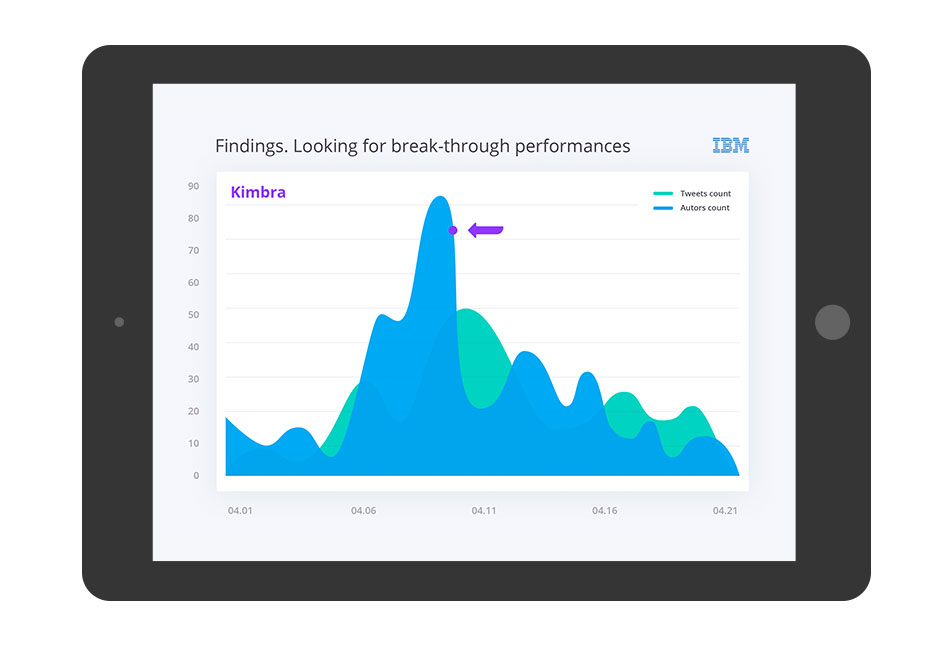
Axmor analysed the most popular festivals and gathered data relating to various events influencing the amount of discourse surrounding an artist.
To evaluate the success of a given event, Axmor developers used the BlueMix Watson Tone Analyzer tone analysis service.