
Smart Vehicle Control
Challenge
IBM’s Emerging Internet Technologies Group develops prototypes and solutions to bring innovative technologies to clients around the world.
The objective was to collect and process racing data collected from powerboat sensors to improve the decision-making ability and safety of the participants in SilverHook Powerboat Racing.
Participants raced at 140+ miles per hour on the open sea with 6+ ft. swells. The extreme speeds and unpredictable conditions of the sea can wreak havoc on the boat’s electronic equipment. A combination of all these factors can damage the boat and threaten the safety of the crew.
Solution
In collaboration with IBM, Axmor specialists designed an application which visualizes data collected from powerboat sensors and GPS navigational equipment. The racing boat sensors provided more than 70 metrics at a refresh rate of 100 times per second.
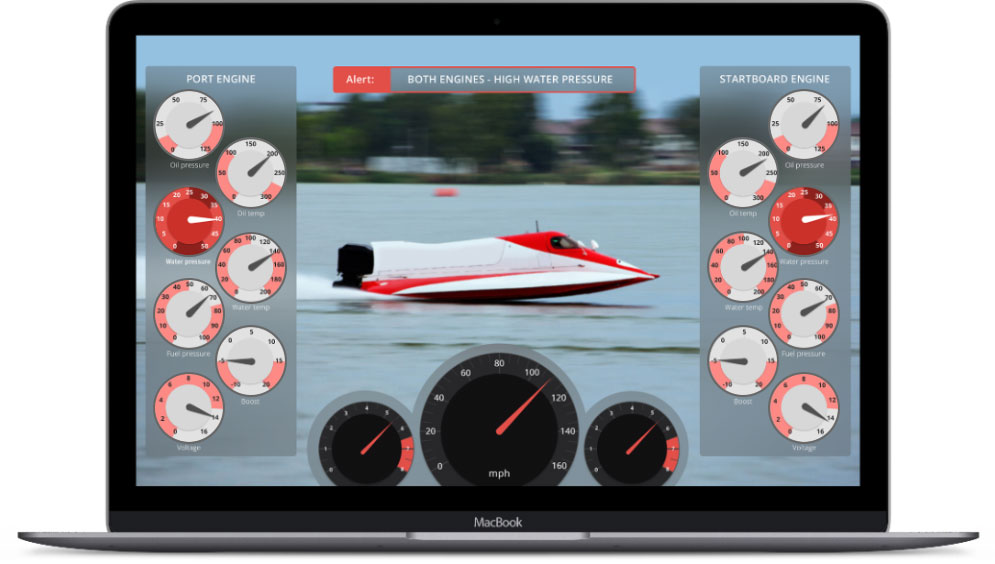
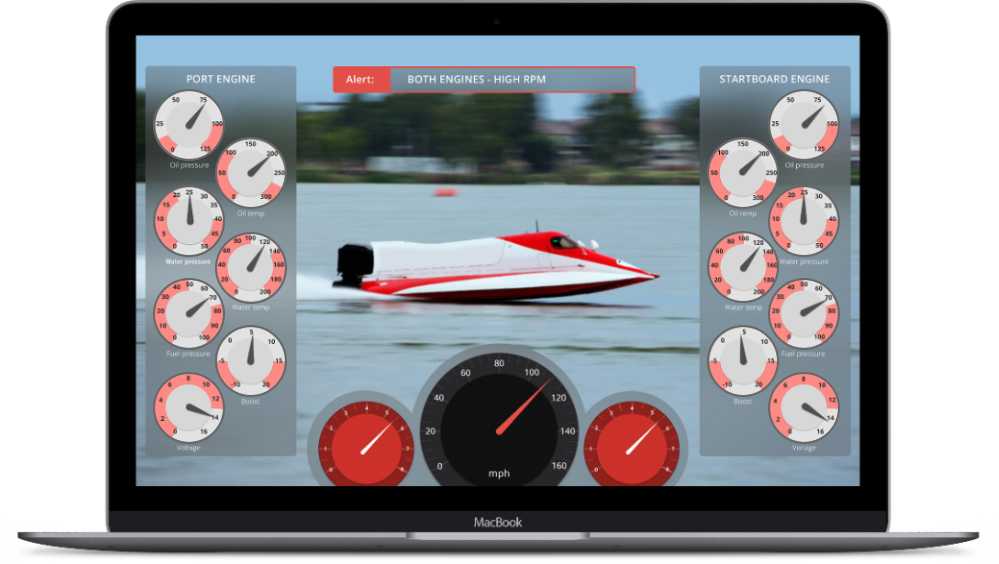
Each participant makes hundreds of critical decisions throughout the race. To improve the decision-making process, the entire crew were given access to telemetry data on the powerboat and its engine.
The most essential data were distilled from more than 70 metrics such as speed, horsepower, oil, and fuel pressure, etc. Based on these metrics and the insights provided, crew members were able to make rapid adjustments to on-board equipment.
For the support team, our engineers developed an extensive dashboard with a vast array of metrics, providing information on current sea conditions and the powerboat location. With the best information at hand, the support team were able to help the crew improve their real-time decision making.
In addition to optimizing real-time decision making, the crew’s support staff were able to plan the race strategy ahead of time, calculating when they should speed up, when they should change course, etc. Calculations were carried out at every waypoint along the route.
Data visualization communicates information through graphical means. All statistical data was collected and analyzed in the cloud in order to lighten the load on the client’s side of the application. This enabled an instantaneous display of up-to-date information on the powerboat’s performance and engine condition.