Challenge
To create an innovative platform to process and analyze operational data in real time based on a new programming language developed by our client.
Solution
Innovations in Big Data Analysis
Every minute, enterprise infrastructures generate huge volumes of data on equipment operation, resource consumption, safety hazards, user behavior, customer relations, fraudulent behavior, and so on. These data need to be analyzed in real time to increase business productivity and efficiency. Conventional means of business analysis are not adequate for this task, since they can only process information for previous periods that have already been captured in data storage.
To detect important business events in enterprise infrastructures and respond promptly, it is necessary to use operational analysis tools when processing big data. These tools can also be used to predict operational hazards, take preventive actions and find new opportunities to attract new clients.
Our customer has developed a new approach to analyzing large volumes of operational data in real time. It was implemented as a flexible platform for the creation and deployment of analytical software solutions for various industries. The platform is used to monitor an enterprise infrastructure and generate real-time reports by analyzing and visualizing large volumes of operational data from various sources.
The platform enables an enterprise to monitor its entire infrastructure in real time. It can be used to detect safety risks and troubleshoot in minutes, minimizing downtime. It also prevents a decline in the quality of customer service by providing up-to-date information about customer relations, behavior, and transactions.
Our customer began developing the platform in-house, but soon realized that larger development resources would be required. To expedite time-to-market, they decided to outsource development to an external team. The customer chose Axmor due to our experience in developing distributed systems for big data processing, development platforms, IDEs and application servers.
Business Modeling and Operational Analysis
Axmor's software developers quickly understood our client's approach and created a platform capable of analyzing large volumes of operational data, forecasting business events, and developing optimal responses to them. The platform was developed using a new domain-specific programming language developed by our customer. This language is based upon functional principles, implements the actor model and supports macros. It is designed to process incoming events and describe business rules in a more compact form and with less effort compared to using general-purpose languages.The platform includes multiple components for operational data analysis. Its core consists of tools for modeling business objects in a virtual environment. Real operational data can be fed into the created model, and the results can be used in decision-making. The platform we developed can be integrated with third-party components to predict problems and determine optimal solutions. As a result, it is possible to monitor key business processes in real time, detect critical events and suggest ways of responding to them (e.g. by recommending specific ways of addressing detected problems). In order to analyze data in real time without delays, we implemented a mechanism that processes data directly in RAM.
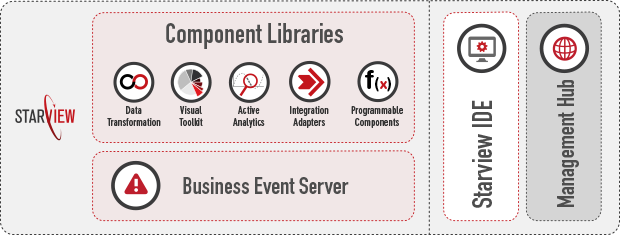
A Multi-component Platform
The operational data analysis platform is a modular multi-component solution with OSGi-based architecture. The platform consists of an Eclipse-based IDE for our customer's domain-specific language, a distributed application server for running the models, visualization components, a web-based management console, and other components. All components are integrated using low-level APIs. To provide for big data analysis, the solution's infrastructure was designed as a mesh topology controlled by hub servers. Prior to being deployed in the production server, the updated model can be tested in the IDE – either with real data or with a previously recorded input data stream. It is also possible to deploy and publish the model to the server from within the IDE.
Interactive Web User Interface
We suggested creating a rich user interface to ensure that the web application has the UI features of a typical desktop application. As a result, we minimized the need to reload the page, thus making the platform more user-friendly.
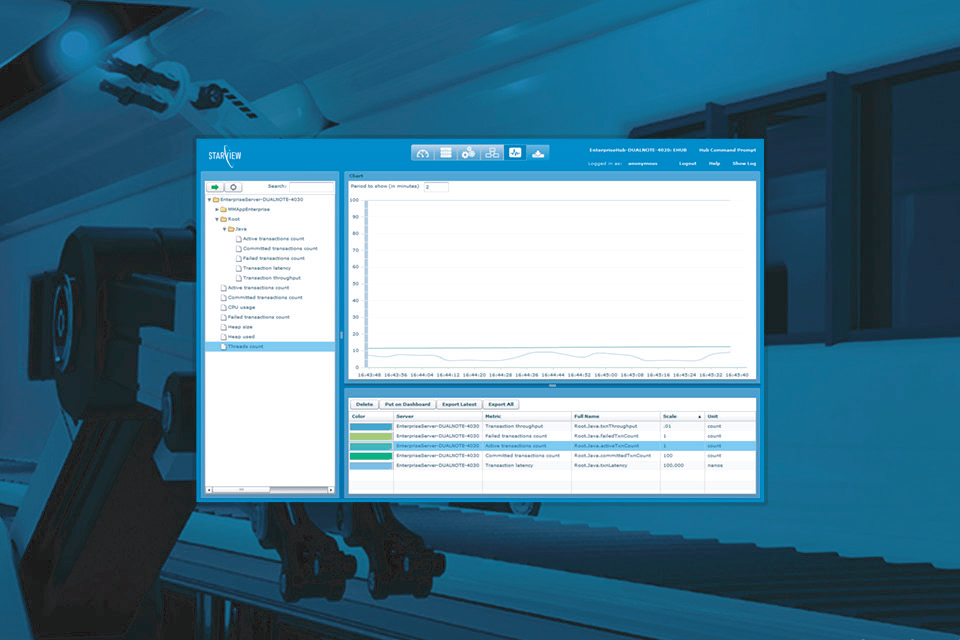
Operational Data Visualization
Visualization makes data analysis more convenient, especially when it comes to big data processing. When monitoring large streams of operational data, it is essential that the user can quickly notice critically important business events. Our software experts developed visualization components allowing the user to configure various ways of presenting the data. For example, a transportation company can visualize changes in the load of its flights on a map. A brokerage company can trace suspicious transactions directly on charts in real time.
Visualization in Business Modeling
Business analysis can also benefit from data visualization. To simplify the modeling process, we developed a graphical editor based on Eclipse RCP, GEF and GMF. Using only a mouse, a business analyst can, for example, create model components and business rules, add external connections to incoming data and modeling results, connect model components, and so on. The application sports convenient multi-select controls and drag-and-drop functionality. This reduced development costs, extended the platform's target audience, and yielded a number of additional benefits.
Distributed Computing
Since calculations with massive models require considerable resources, the computing environment was designed and implemented as a mesh of servers controlled by a coordinating hub. One or more models can be hosted on each of the processing servers depending on the resources available. Each of the servers has a web console of its own, providing basic functionality (status and diagnostics). The entire network is managed from the console of the coordinating hub.
Further Platform Improvements
We created a platform based on a new programming language developed by our client. This could pose difficulties for users who are not familiar with this language. With that in mind, we added Java API support, which allowed users to conveniently program business rules in a widely known and popular language. Our software experts constantly monitored emerging technologies and suggested new opportunities for improvement. For example, OSGi was used for easier versioning and modeling. Standardization and decoupling of elements helped to reduce development, support, and maintenance costs. Moreover, the IDE was improved using the recently released xText library for Eclipse. This resulted in improved support for programming languages (including outline visualization of code structure) as well as in better code navigation and search.
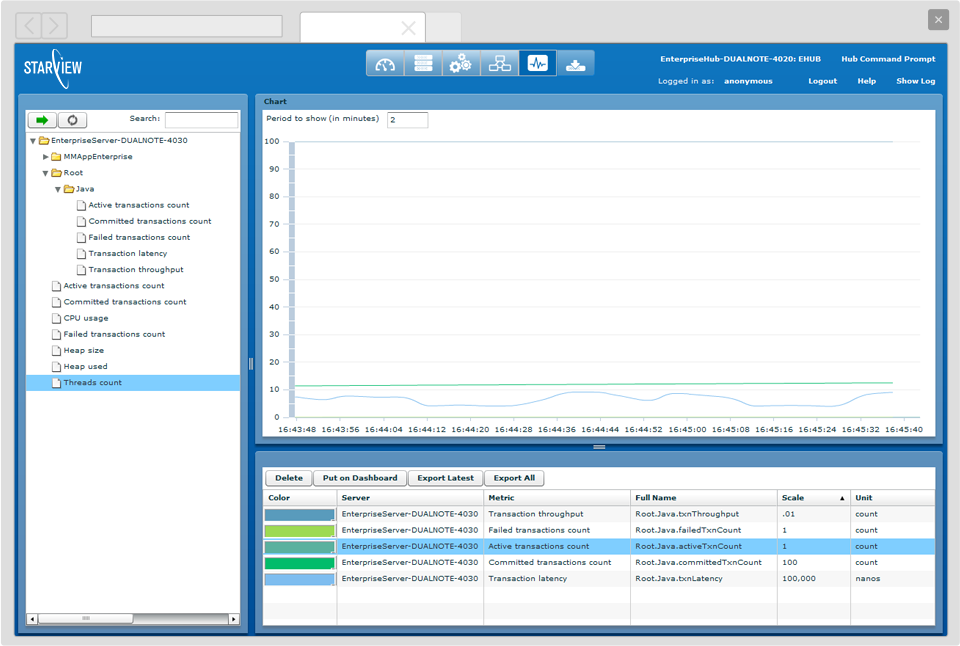
The Platform's Market Entry
In addition to the platform itself, we developed a number of applications for specific business needs. Now, the customer can show these demo applications to potential platform buyers. The main demo is an analytical software for monitoring the IT infrastructures. It detects operational risks and minimizes system failures and downtime.